Understanding the Performance Management Chart in Freediving
Learn how Fitness, Fatigue, and Form metrics help you train smarter, peak at the right time, and avoid overtraining.
The Performance Management Chart (PMC) is one of the most powerful analytical tools in sports. Although it originates from endurance disciplines like cycling or running and is widely used by athletes worldwide, it has been adapted in freediver.club directly to the physiology of breath-holding. It allows you to monitor training load, optimize recovery, and plan peak performance for competitions or personal bests. However, for the chart to show the truth, we must understand where its data comes from and how each metric is mathematically calculated.
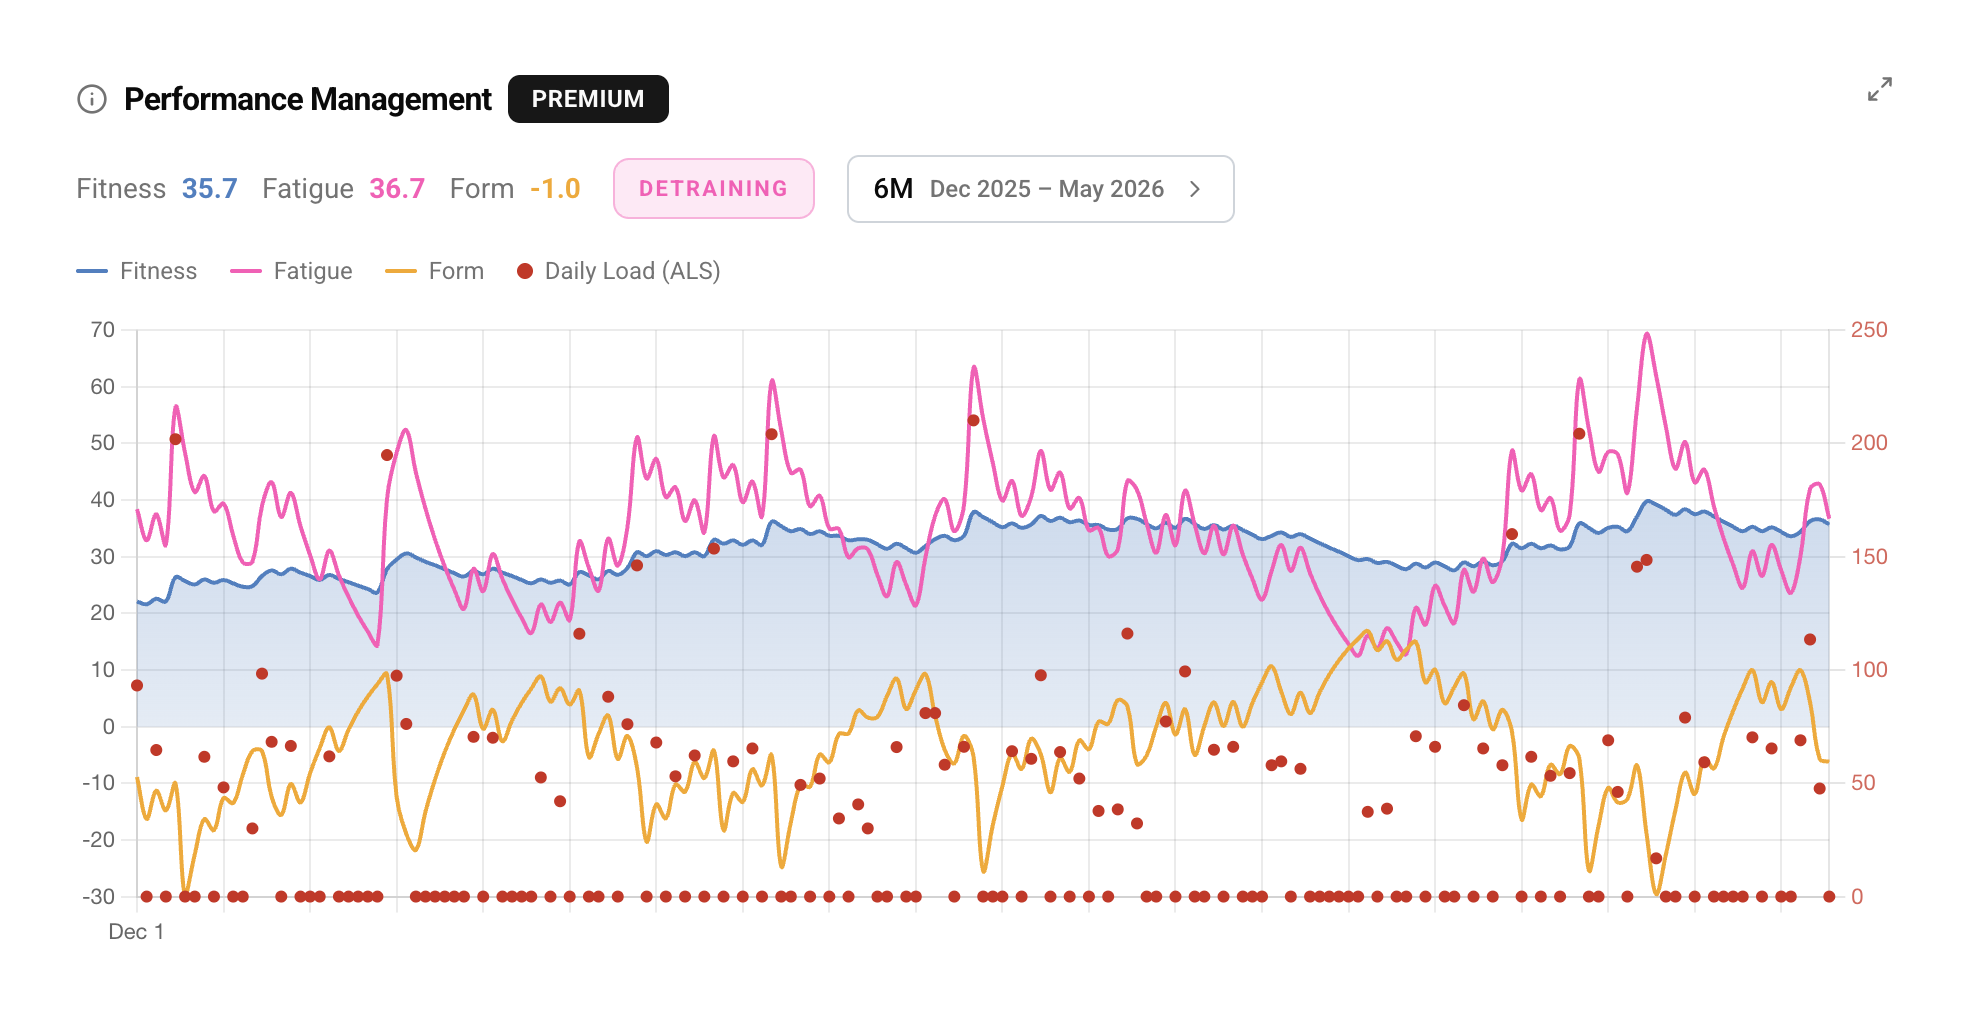
Example Performance Management Chart showing Fitness, Fatigue, and Form
Everything Starts with ALS (Apnea Load Score)
The foundation of the entire chart is the Apnea Load Score (ALS). Unlike traditional sports where heart rate or power is measured, ALS is an original training load metric designed from scratch specifically for breath-hold physiology. ALS determines the level of fatigue inflicted on the body by a single set or exercise.
For each individual training element (such as one static apnea repetition or one underwater swim), the ALS score is calculated based on the breath-hold duration multiplied by a recovery factor and a factor related to the specific freediving discipline.
This score takes three key factors into account: the breath-hold duration (which contributes non-linearly — longer holds carry disproportionately more load than the same total volume split into shorter segments), the recovery time between repetitions (shorter rest between holds raises the load), and the discipline type (no-fins work demands more from the body than static apnea or fin-assisted swimming).
How does the system obtain the breath-hold duration?
In an ideal scenario, the app imports the actual stopwatch time from your device (e.g., Garmin, Suunto, or Apple Watch). However, if this data is missing (only distance or depth was recorded), the system performs an intelligent time estimation based on the freediver's average speed:
-
For depth: Estimated time =
(depth × 2) / descent_speed(assumes travel down and up). -
For pool (dynamics): Estimated time =
distance / swimming_speed. - For static (STA): The direct time in seconds is always used.
These speeds are fetched from the user's profile settings (default values are used if not configured). Daily ALS is simply the sum of the ALS values of all repetitions across all workouts logged on that day.
Why you must log EVERY workout?
Consistency in logging workouts is crucial for the Performance Management Chart to work correctly. The algorithm relies on continuous data. If you forget to log a workout, the system assumes that your day brought 0 ALS.
Since fitness and fatigue are based on moving averages, a single missing workout will artificially drop your fitness level and inflate your "Form" (freshness). This causes the chart to show complete recovery when, in reality, your body might be on the verge of overtraining. Consistently logging even light warm-ups (which translates into a lower but non-zero ALS) maintains the model's accuracy.
How are the chart metrics calculated?
The Performance Management Chart consists of three lines generated by processing daily ALS values using exponentially weighted moving averages (EWMA). To seed the chart at a realistic level, the system performs a 42-day "warm-up" period before the selected start date, starting from initial values of 0.
Fitness
Represents the long-term adaptation of your body to training loads. It is calculated as an exponentially weighted moving average over the last 42 days. Fitness increases slowly with consistent training and decays slowly (detraining) when you rest.
Fatigue
Shows short-term training load from recent sessions. It is calculated as an exponentially weighted moving average over the last 7 days. Fatigue reacts dynamically: a single hard session can spike this line, but a few days of rest will quickly bring it back down.
Form
The difference between your overall fitness and current fatigue. It is calculated based on yesterday's data (before today's load is applied), providing a precise view of your readiness before starting a new training day.
How to interpret your Form?
Your Form value helps you assess your body's status and adjust your upcoming training sessions:
Positive Form (> 0)
Freshness and recovery. Your fatigue is lower than your fitness. This is the perfect time for maximum attempts, deep dives, or competitions. However, staying in this zone for too long leads to fitness decay.
Negative Form (< 0)
Building and fatigue. A natural state during a training block. Your body needs this load to trigger adaptation (supercompensation). Be cautious, however: drops below -20/-30 can signal overtraining risk.
Form near 0 (-5 to +5)
Balance. Maintaining fitness. A good time for technique drills or moderate sessions that keep your levels stable without overloading you.
Understanding your Fitness Trend
In freediver.club, next to the chart, you will find information about your current trend, which is calculated based on changes in Fitness over the last 14 days:
- Building: When Fitness increases by more than 1.0 over the last 14 days. This shows your workouts are frequent and hard enough to develop capacity.
- Detraining: When Fitness decreases by more than 1.0 over the last 14 days. Suggests a recovery block or a period of inactivity.
- Maintaining: When the change in Fitness stays between -1.0 and +1.0. Your training load balances perfectly with your fitness decay, keeping your performance stable.
Supplementary Materials
To help you better understand the Performance Management Chart and associated training load metrics, check out these video explanations:
Analyzing Training Load and the PMC Chart
How to plan recovery and peak performance based on metrics
Summary
The Performance Management Chart is a virtual mirror of your physiology. Logging workouts consistently allows the system to predict when you're ready to peak and when your body needs rest. Use this knowledge, listen to your body, and train safely with freediver.club!
Bartosz Jakubowiak
25 maja, 2026 • 5 min. czytania(edytowano 30 maja, 2026)